6.1 Crystallographic data
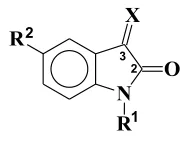
The crystallographic data for isatin reveals that it is almost planar, with a bond length between the two carbonyls of 1.55 Å. This large value was attributed to lone pair electron repulsion between the two oxygen atoms516,517. This interpretation was however, subsequently refuted by comparison of bond lengths of cis and trans 1,2-diketones where no systematic or substantial difference between the bond lengths was observed518. A similar bond length was observed for 1-acetylisatin519, 1-α-chloroacetylisatin520, diethyl (2,3-dihydro-2-oxo-3-indolylidene) propanedioate521, 1,1’-oxalylbisisatin522 and 1-methylisatin523. Further, similar bond lengths were also observed in derivatives where C-3 is tetrahedral, such as 3,3-dichloro-1H-indol-2(3H)-one524 and 5’-bromospiro-[1,3-dioxolano-2,3-indolin]-2’-one525, as well as for 3-methyleneoxindoles526 (Table 1). Ring opened products, obtained by nucleophilic attack upon 1-acetylisatin, possess a 1,2-dicarbonyl system that assumes a s-trans conformation527 that also reveals a similar bond length. The crystal structure of 2-methoxyisonitrosoacetanilide, an intermediate in the Sandmeyer procedure for the synthesis of 7-methoxyisatin has also been determined528.
Table 1. Bond lenghts or lengths (in the editors’ view) between C-2 and C-3 in isatin and derivatives
| X | R1 | R2 | C2-C3 (Å) |
|---|---|---|---|
| O | H | H | 1.55 |
| O | Ac | H | 1.538 |
| O | Me | H | 1.545 |
| Cl, Cl | H | H | 1.556 |
| OCH2CH2O | H | Br | 1.539 |
| CHCH=C(CH3)2 | H | H | 1.508 |
6.2 Infrared spectroscopy
The infrared spectrum of isatin shows two strong bands at 1740 and 1620 cm−1 corresponding to the carbonyl stretching vibrations. A broad band occurs at 3190 cm−1 due to the N-H stretching, and it is accompanied by many sub-bands, all of which are moved to lower frequency on deuteration. This also affects several bands in the region 1400-1100 cm−1 wich or which (in the editors’ view) are associated with N-H in-plane bending529,530. Although the νC=O values are not modified by N-alkylation, N-acetylation leads to a hypsochromic shift of the lactam absorption of about 50-70 cm−1, while the ketone band shifts to 1750 cm−1, as a consequence of the extension of conjugation of the nitrogen lone pair with the acetyl group100. On the other hand, 3-methylene-oxindoles show a bathochromic shift for the lactam band of around 20 to 30 cm−1, this shift being greater when there are groups at the C-3 position, such as OH, which can form a hydrogen bond with the lactam carbonyl. In this case, νC=O appears at 1660 cm−1 436. 3,3-Difluorooxindoles reveal a hypsochromic shift of about 20 cm−1 in comparison to the respective isatin512.
6.3 ¹H NMR spectroscopy
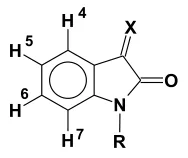
The 1H NMR spectrum of isatin shows the signals of the aromatic nucleus at δ 6.86 (d), 7.00 (t), 7.47 (d) and 7.53 (t) (DMSO-d6), corresponding to H-7, H-5, H-4 and H-6 respectively. While N-alkylation does not alter this pattern, N-acetylation leads to a downfield shift of all the signals, but most significantly of H-7 due to the anisotropic effect of the carbonyl group. In a similar fashion, 3-methyleneoxindoles bearing cyano groups reveal a high frequency shift of H-4 by about 0.6-1.0 ppm, with no significant effect over the other signals531,532 (Table 2).
Table 2531. Influence of N-1 and C-3 substituents on 1H NMR chemical shifts of isatins
| X | R | H-4 | H-5 | H-6 | H-7 | CH3CO |
|---|---|---|---|---|---|---|
| O | H | 7.50d | 7.07t | 7.60t | 6.92d | - |
| O | Me | 7.59d | 7.12t | 7.61t | 6.91t | - |
| O | Ac | 7.27d | 7.33t | 7.70t | 8.38d | 2.73s |
| C(CN)2 | H | 7.87d | 7.12t | 7.59t | 6.94d | - |
Solvent: DMSO-d6
6.4 ¹³C NMR spectroscopy
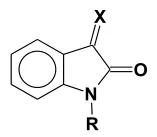
The 13C NMR spectrum of isatin was the object of controversy in the literature. Different proposals for assignment of the signals have been published42,533-535. This question was resolved by the obtention of the HETCOR spectrum, which revealed that the assignment proposed by Galasso, based on quantum mechanical calculations using the CNDO/S wave functions, was correct534. This result allowed the correction of the assignments of the spectra of 1-acetylisatin536-538 and of 1-methylisatin and 3-dicyano-methyleneoxindole510,500. Again, acetylation of N-1 implies an important change in the pattern of the spectra, with a deshielding effect over C-7536 (Table 3).
Table 3. Influence of N-1 and C-3 substituents on 13C NMR chemical shifts of isatins
| X | O | O | O | C(CN)2 |
|---|---|---|---|---|
| R | H | Ac | Me | H |
| C-2 | 159.6 | 157.8 | 158.1 | 163.6 |
| C-3 | 184.6 | 180.1 | 183.2 | 146.4 |
| C-3a | 118.0 | 119.1 | 117.2 | 137.8 |
| C-4 | 124.8 | 126.1 | 125.0 | 122.9 |
| C-5 | 123.0 | 125.2 | 123.7 | 118.5 |
| C-6 | 138.6 | 138.6 | 138.4 | 125.7 |
| C-7 | 112.4 | 118.1 | 109.9 | 111.6 |
| C-7a | 150.9 | 148.5 | 151.3 | 150.4 |
| Reference | 534 | 536 | 510 | 510 |
6.5 Mass spectrometry
The electron-impact mass spectra of isatin539, 1-alkylisatins540 and derivatives, such as hydrazones541, usually show an intense molecular ion peak. In the case of 3,3-dissubstituted or disubstituted (in the editors’ view) oxindoles542, the base peak corresponds to the loss of the substituents at C-3. A peak corresponding to the loss of CO (ion a) can also be observed, whose intensity decreases with the increase in size of the alkyl chain of 1-alkylisatins543. Ion a usually looses or loses (in the editors’ view) HCN, leading to a fulvene ion (ion b). An arene aziridine is also observed (ion c), which arises from a second loss of CO544-546. The ions b and c are also observed in the gas-phase pyrolysis of isatin547. In a general manner, the mass spectra of 3-substituted isatins show a sequential loss of neutral molecules548 (Scheme 135).
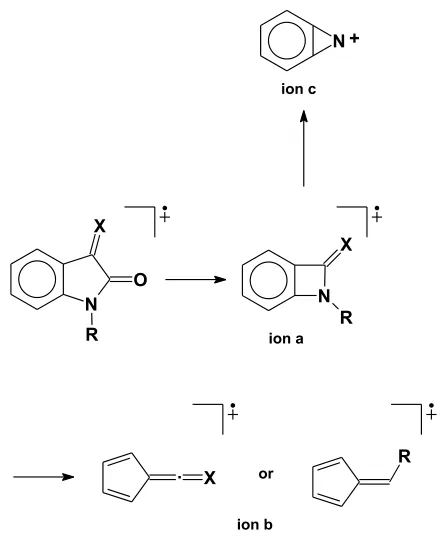
Scheme 135.
A different pattern is observed in the mass spectra of isatin-3-oximes, where a peak corresponding to the loss of CO is not found; this is attributed to a Beckmann rearrangement of the molecular ion leading to a heterocyclic ring opened ion549.
In the case of the acetylated derivatives, the molecular ion is usually of low intensity. The fragmentation pattern includes loss of ketene (ion d) and of CO (ion e) (Scheme 136).
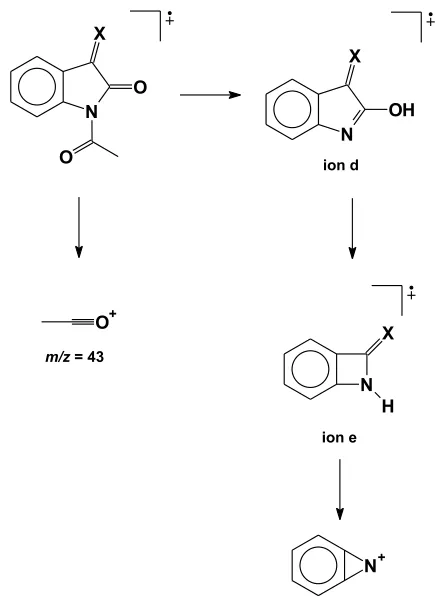
Scheme 136.
6.6 ¹⁴N NQR
The 14N nuclear quadrupole resonance of isatins and derivatives has been thoroughly studied as this method can furnish important information with respect to the electronic distribution around the nitrogen atom. The results obtained confirmed the existence of H bonds between isatin molecules in the solid state550, and showed a linear relationship between the depletion of charge of the C-N bonds and the electron withdrawing character of the substituents attached to the aromatic nucleus, as represented by the inductive Taft parameter551. The results also revealed that the lone pair of electrons of the nitrogen atom is involved in conjugation with the aromatic ring552.
6.7 Further spectroscopic data
The eletronic or electronic (in the editors’ view) absorption spectra of isatin553-555, isatin-3-arylhydrazones556, isatin and 1-methylisatin anion radicals557 were studied and correlated with theoretical calculations with good results. The electron spin resonance spectra of the isatin anion radical was also recorded and revealed that the monoanion radical exists in equilibrium with the dianion radical in the solvents employed560. DSC thermograms of some alkylisatins were also recorded558.